Among the crucial steps for each advertiser while running ad campaigns is choosing a pricing model and allocating the minimum budget for a statistically significant test. You surely know that Mirelia Network’s DSP provides two pricing models: CPC and CPM. When choosing a pricing model, you first need to determine how they are working.
CPC vs CPM
With CPM (cost-per-mile), you pay for the number of times an ad is demonstrated. The payment is charged for all the views, regardless of how many visitors clicked on your ad.
CPC works in an opposite manner(cost-per-click), where you pay for every click on your ad.
Let’s look deeper into the difference between these two models:
The best thing about the CPC model for advertisers is that they are only charged when users click on the ad. By pressing on your ad, the user is already engaged in the product, which means that you are paying exclusively for the targeted audience. In this case, the quality of banners is not as important as when you promote through CPM. Moreover, you do not even need to upload any banners in CPC campaigns because our team has already tested and made available the best performing banners from our sources.
Tip! The CPC rate on our platform depends on the selected segment of the audience, geo and device type. The minimum CPC rate starts at $0.01. You can find the table with all the minimum rates available on the CPC campaign creation page. In addition, feel free to contact your account manager to find out the relevant average and maximum bids.
Speaking of the CPM model, it is more valuable when you want to draw attention to your service or product. At Mirelia Networks, you have numerous opportunities for testing your hypothesis and various promotion options, thus, you may let your imagination run wild, download, and optimize your own banners in any suitable way.
The quality of banners is of the utmost importance. Our task is to show your banner, and your task is to engage the user to click on the creative. Hence, you need to optimize the banners and see which one performs better.
Great! Now you know the difference between CPC and CPM pricing models, and surely, you have already determined which model will be better for you.
Test budget for CPC and CPM campaigns
From time to time the question arises among the advertising community of what would be the appropriate average budget for testing CPC and CPM campaigns. And although there would most certainly not be a unified opinion on this matter, since everyone employs a different tactic, some advertisers agree that 10–50 clicks is enough to make a decision about the quality of the traffic. On the other hand, more experienced advertisers would agree that it really takes time and money to find profitable combinations to run a statistically significant test.
Our business intelligence department has defined an approximate minimum budget to test CPC and CPM campaigns based on collected data.
Let’s start with CPM. We are using the dynamic CPM system. As a result, we are charging only the real price per each user’s impression, and you get the relevant traffic at the fare price.
At Mirelia Networks, we have divided all traffic into three groups:
- Paid-users who have passed through the paid funnel
- Not paid-users outside of the paid funnel
- All-users both paid and not paid.
In the graphic below, you can find the minimum budget for all three categories:
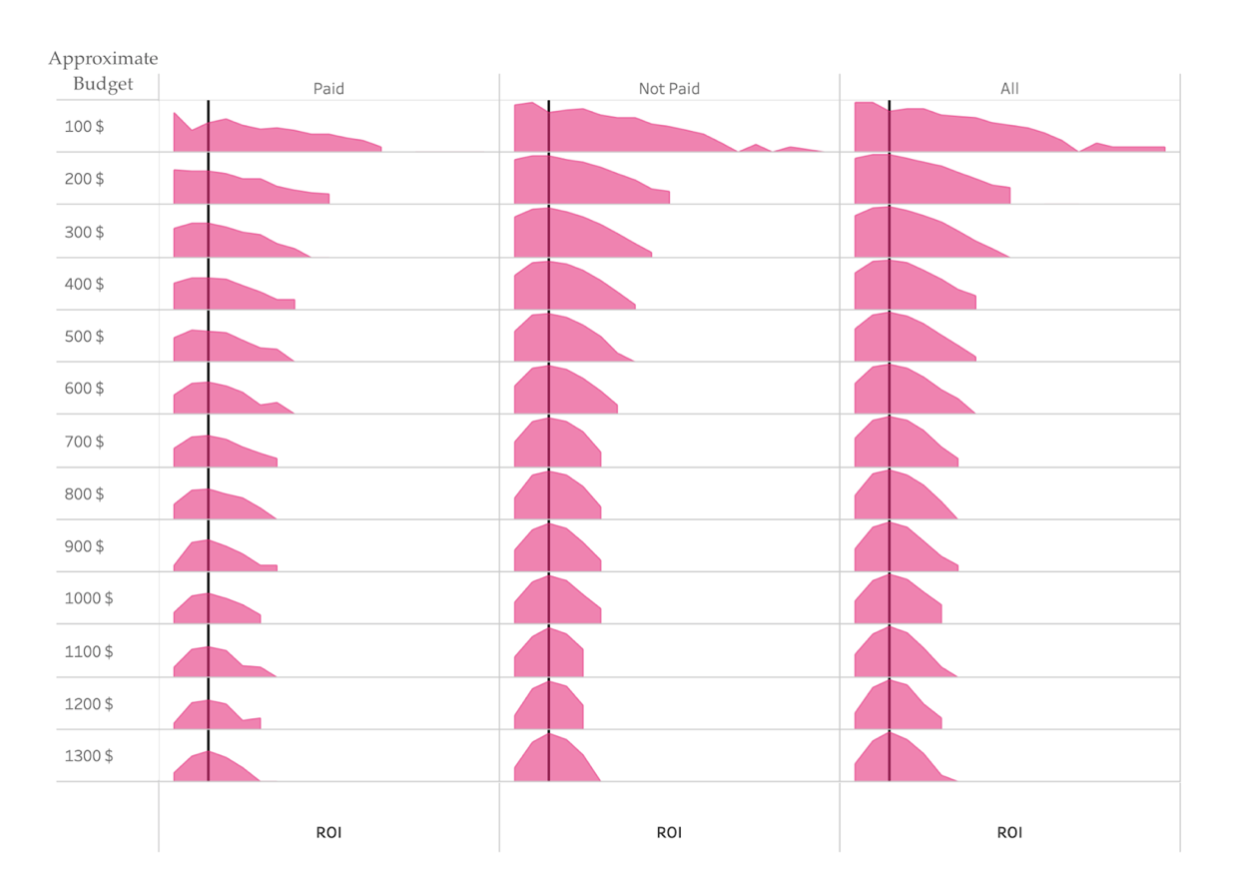
Thus, to get statistically significant results in campaigns with Paid users, your minimum budget should be at least $400. With Not paid users, you can forecast positive ROI with a minimum budget from $200-400. When considering All Users, $300 will be enough to see the defining result.
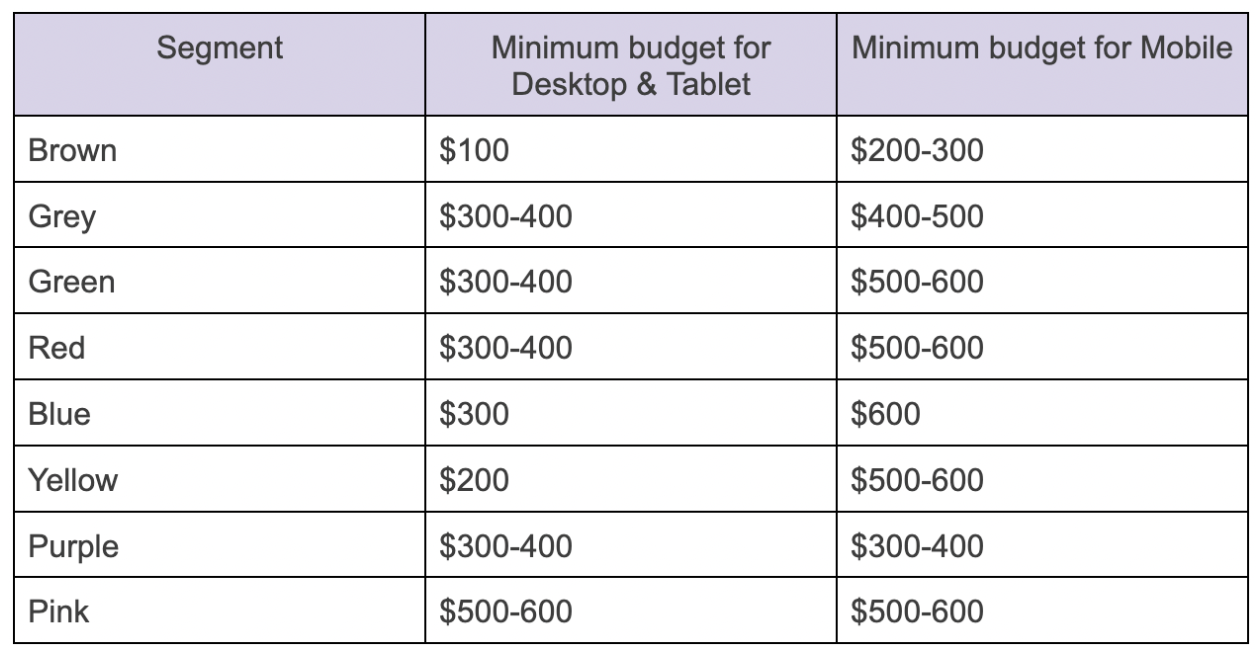
Moving on! As we have already mentioned before, the CPC rate is determined by the selected geo, segment, and device type. We analyzed traffic in every segment according to users' LTV and loyalty to purchase, and found the average minimum test budget for each one. For ease of perception, all segments were named by color. Thus, the Brown segment will have a lower click-to-conversion ratio than the Red, and so on.
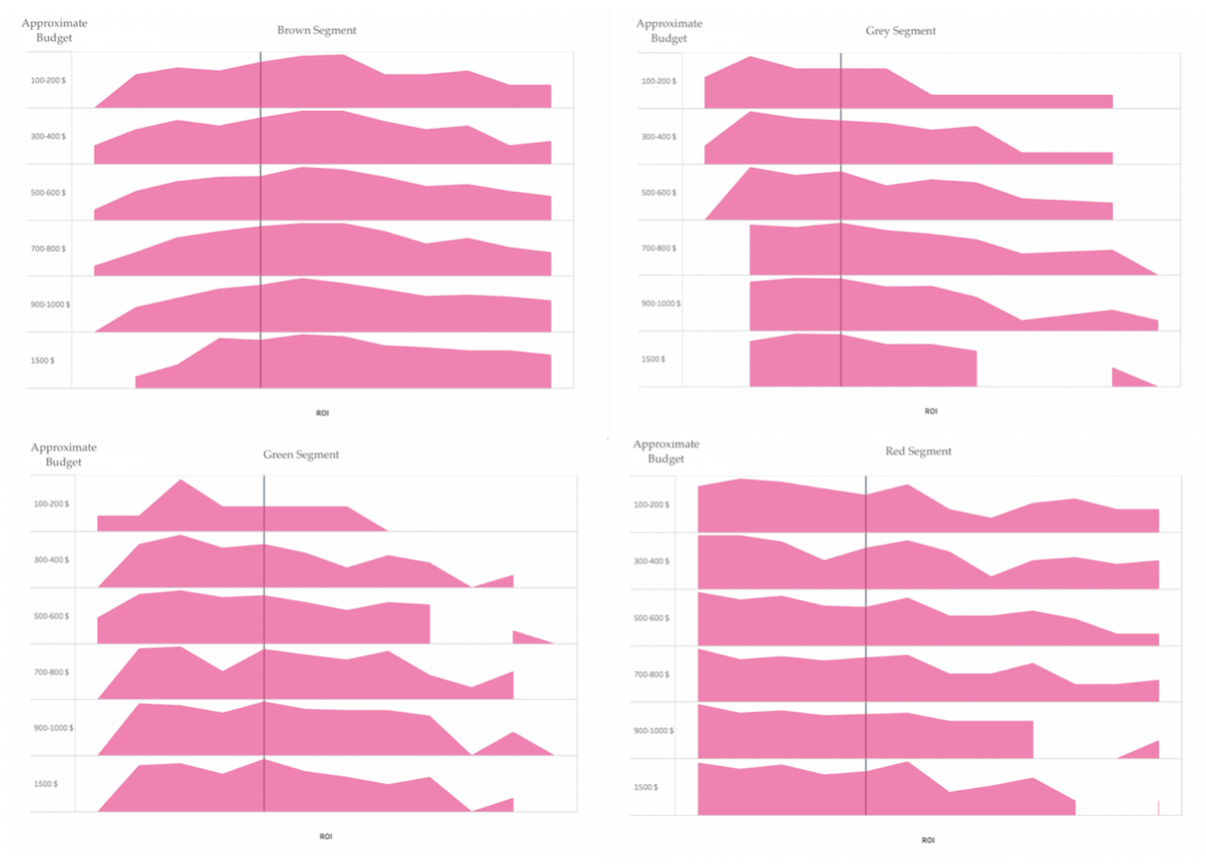
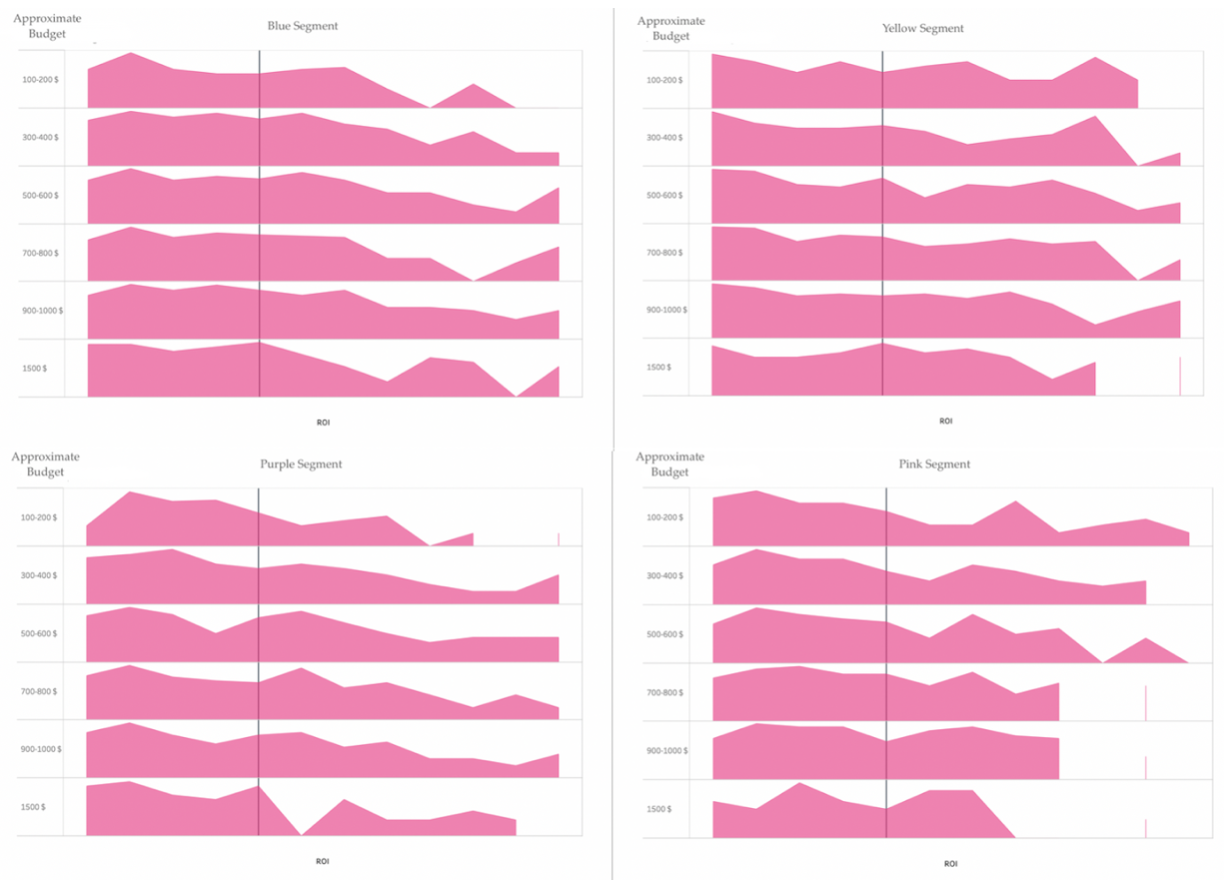
By analysing the tables with all color segments, the following conclusions can be drawn:
All the data above is just an approximate example to understand how much money you need to spend for statistically significant results and a positive ROI. No doubt, each advertiser can achieve different results as it depends on many factors, such as offer, targeting settings, bids, chosen segment, landing page, etc.
To achieve a positive ROI, first of all, you have to select quality offers, regularly optimize ad campaigns, and, of course, monetize traffic well. You can always create additional monetization funnels to draw users’ attention to your products and increase your profit. Surely, it takes time and resources, but in return, you will find a perfect branch.
Read more about traffic monetization in the next article: Efficient ways of traffic monetization
Valeriya S.,
Account Manager at Mirelia Networks.